IceCube realtime alert:
| Report generated (UTC): | 2023-05-12 05:39:06 |
| Current time (UTC): |
Back to all alerts
Alert properties
| Event type: | |
| RA (J2000) [deg]: | |
| Dec (J2000) [deg]: | |
| Error radius [deg]: | |
| Trigger time: | |
| Run ID: | |
| Event ID: | |
| GCN Notice: |
Skymaps
|
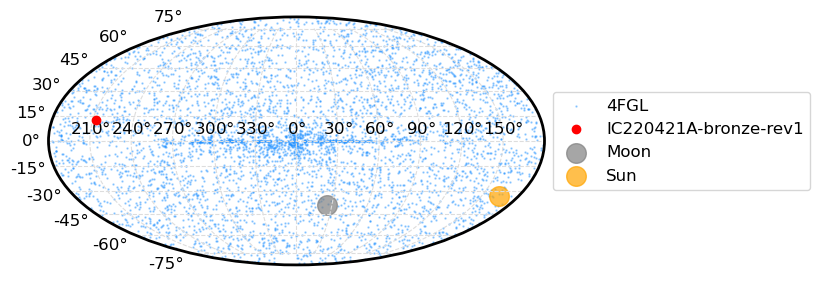
All-sky equatorial

|
All-sky Galactic
|
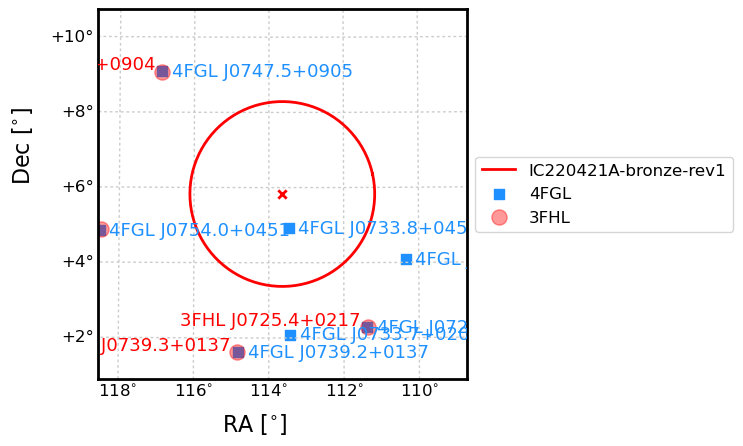
Nearby 4FGL sources
Fermi sources are shown within a 5 deg radius from the alert best-fit position. Sources contained within the error circle of the alert are highlighted in color. For sources with a known association, "Search Simbad" returns an identifier query using the association name listed (note that in many cases the association name is not resolved by Simbad). If no association is listed, return a radial search 0.3 deg around the Fermi source position.
| Name | RA [deg] | Dec [deg] | Association | Search | Distance [deg] | MWL |
|---|---|---|---|---|---|---|
| 4FGL J0733.8+0455 | 113.47 | 4.93 | GB6 J0733+0456 | Search Simbad | 0.92 | LCR FAVA DX |
| 4FGL J0721.3+0405 | 110.35 | 4.09 | PMN J0721+0406 | Search Simbad | 3.71 | LCR FAVA DX |
| 4FGL J0733.7+0205 | 113.44 | 2.09 | 4C +02.20 | Search Simbad | 3.74 | LCR FAVA DX |
| 4FGL J0725.5+0216 | 111.39 | 2.27 | NVSS J072534+021645 | Search Simbad | 4.20 | LCR FAVA DX |
| 4FGL J0739.2+0137 | 114.82 | 1.62 | PKS 0736+01 | Search Simbad | 4.37 | LCR FAVA DX |
| 4FGL J0747.5+0905 | 116.88 | 9.09 | RX J0747.3+0905 | Search Simbad | 4.57 | LCR FAVA DX |
| 4FGL J0754.0+0451 | 118.52 | 4.86 | GB6 J0754+0452 | Search Simbad | 4.96 | LCR FAVA DX |
Nearby 3FHL sources
Fermi sources are shown within a 5 deg radius from the alert best-fit position. Sources contained within the error circle of the alert are highlighted in color. For sources with a known association, "Search Simbad" returns an identifier query using the association name listed (note that in many cases the association name is not resolved by Simbad). If no association is listed, return a radial search 0.3 deg around the Fermi source position.
| Name | RA [deg] | Dec [deg] | Association | Search | Distance [deg] | MWL |
|---|---|---|---|---|---|---|
| 3FHL J0725.4+0217 | 111.37 | 2.29 | NVSS J072534+021645 | Search Simbad | 4.20 | LCR FAVA DX |
| 3FHL J0739.3+0137 | 114.83 | 1.63 | PKS 0736+01 | Search Simbad | 4.37 | LCR FAVA DX |
| 3FHL J0747.4+0904 | 116.87 | 9.08 | RX J0747.3+0905 | Search Simbad | 4.56 | LCR FAVA DX |
| 3FHL J0753.9+0452 | 118.49 | 4.88 | Search Simbad | 4.92 | LCR FAVA DX |
Fermi-LAT prompt analysis
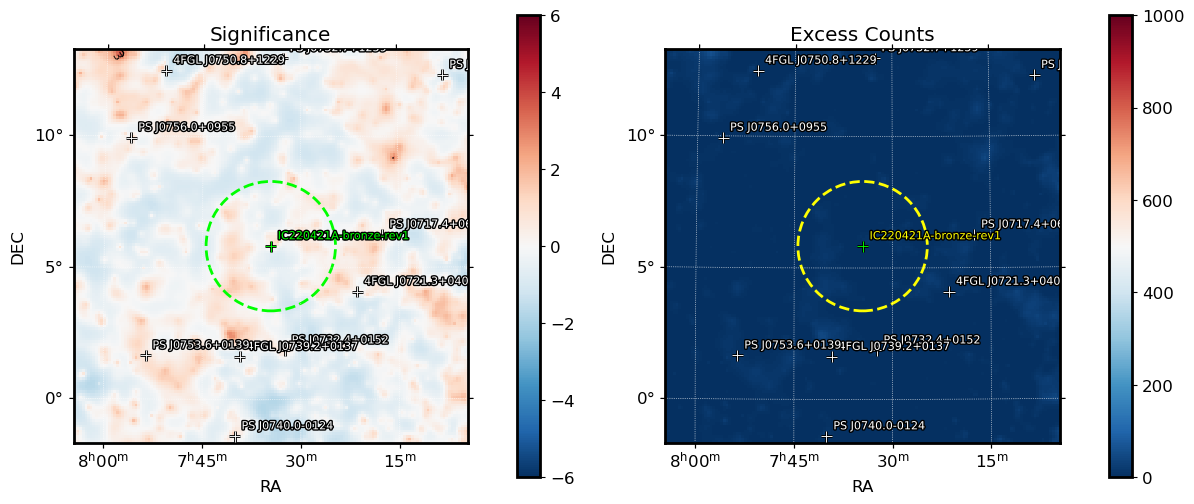
Fermi-LAT analysis of the alert over two different timescales of one month and the full mission.
One month results
 |  |
 |
|
 |
|
Results per source
Fermi sources with a TS > 9 are included in this list. Links are provided for the spectral fits results as a plot, and in FITS and npy format.
| Name | RA [deg] | Dec [deg] | Distance [deg] | Spectrum type | TS | Flux above 100 MeV [ph cm^-2 s^-1] | 4FGL-DR3 flux above 100 MeV [ph cm^-2 s^-1] | Result files |
|---|---|---|---|---|---|---|---|---|
| 4FGL J0721.3+0405 | 110.35 | 4.09 | 3.71 | LogParabola | 23.04 | 3.456e-08 | 9.479e-10 | Spectrum plot FITS file npy file |
| PS J0732.4+0152 | 113.11 | 1.87 | 4.00 | PowerLaw | 13.37 | 2.469e-08 | N/A | Spectrum plot FITS file npy file |
| PS J0717.4+0615 | 109.37 | 6.25 | 4.27 | PowerLaw | 13.25 | 8.960e-10 | N/A | Spectrum plot FITS file npy file |
| 4FGL J0739.2+0137 | 114.82 | 1.62 | 4.37 | LogParabola | 208.46 | 1.607e-07 | 5.891e-09 | Spectrum plot FITS file npy file |
| PS J0753.6+0139 | 118.40 | 1.65 | 6.32 | PowerLaw | 13.36 | 5.287e-10 | N/A | Spectrum plot FITS file npy file |
| PS J0756.0+0955 | 119.02 | 9.93 | 6.72 | PowerLaw | 16.57 | 1.400e-08 | N/A | Spectrum plot FITS file npy file |
| PS J0732.7+1259 | 113.18 | 12.98 | 7.17 | PowerLaw | 14.74 | 5.053e-09 | N/A | Spectrum plot FITS file npy file |
| PS J0740.0-0124 | 115.01 | -1.40 | 7.36 | PowerLaw | 16.88 | 2.264e-09 | N/A | Spectrum plot FITS file npy file |
| 4FGL J0750.8+1229 | 117.70 | 12.49 | 7.78 | PowerLaw | 37.64 | 6.373e-08 | 8.322e-10 | Spectrum plot FITS file npy file |
| PS J0707.8+1218 | 106.97 | 12.31 | 9.23 | PowerLaw | 14.30 | 2.997e-08 | N/A | Spectrum plot FITS file npy file |
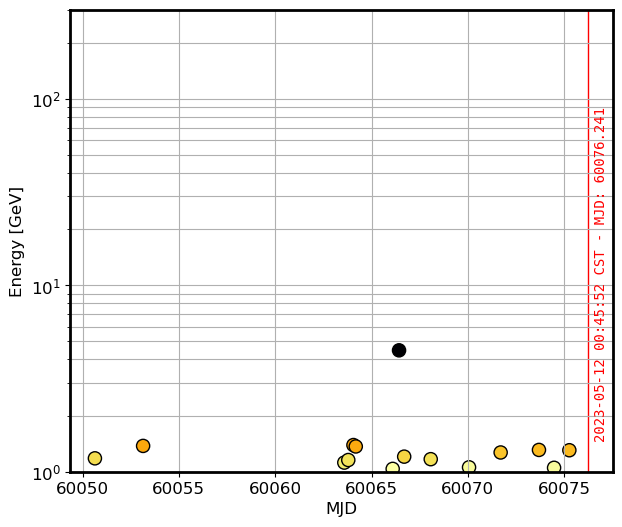
Fermi-LAT GeV photons
GeV photons observed from the direction of the alert over the last month
 |  |
Interactive skymap
The interactive window shows a background of the Fermi (color) skymap and markers for nearby sources in three HE catalogs: 4FGL, 3FHL, and 2WHSP. Other catalogs (2RXS and BZCat) plus a dynamic HiPS search in Simbad can be enabled from the layer control of the left. An additional Simbad search shows a selection of objects (detected in radio, X-rays, gamma-rays and/or galaxies) near the best fit position. The background sky can be changed to optical (Mellinger survey) from the radio buttons below the image.
Visibility
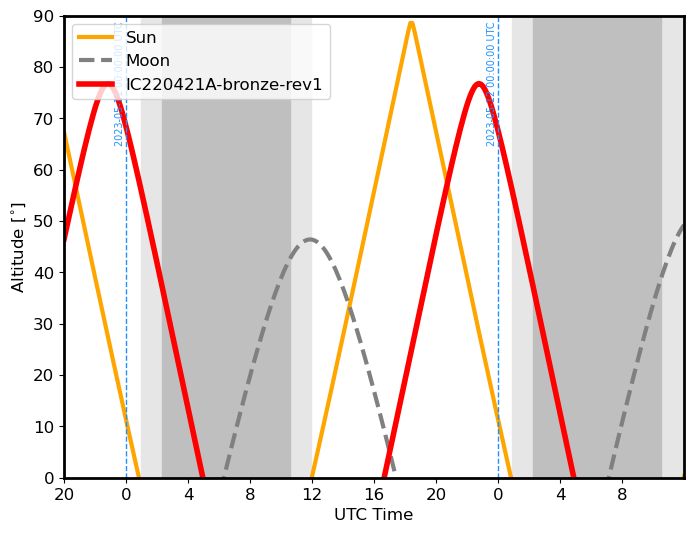
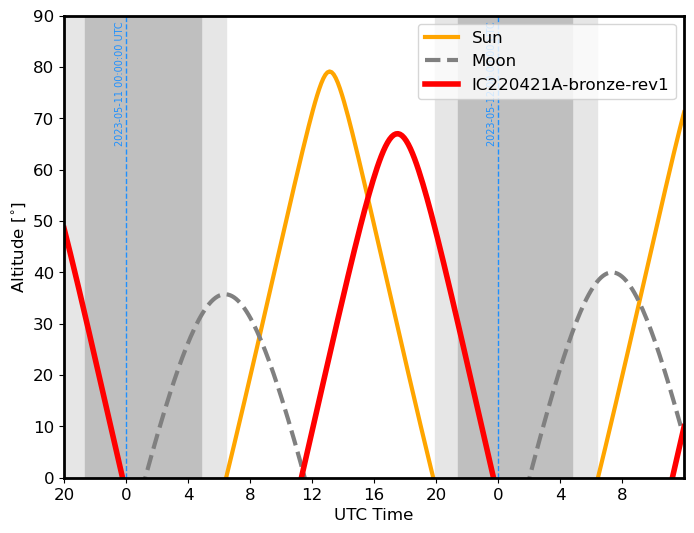
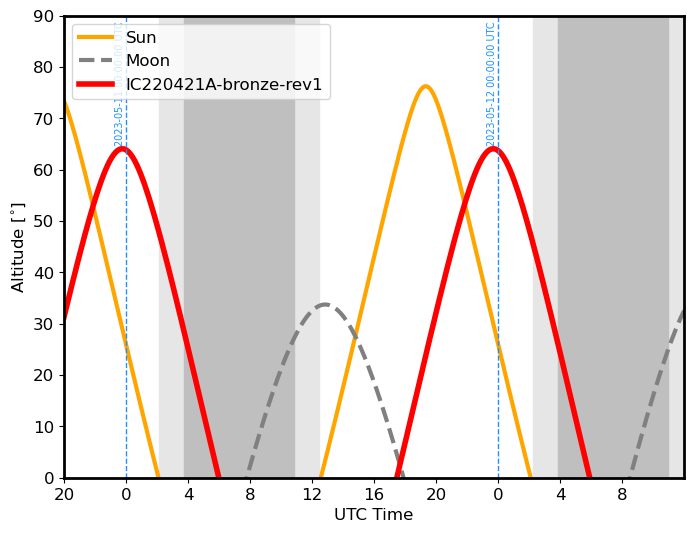
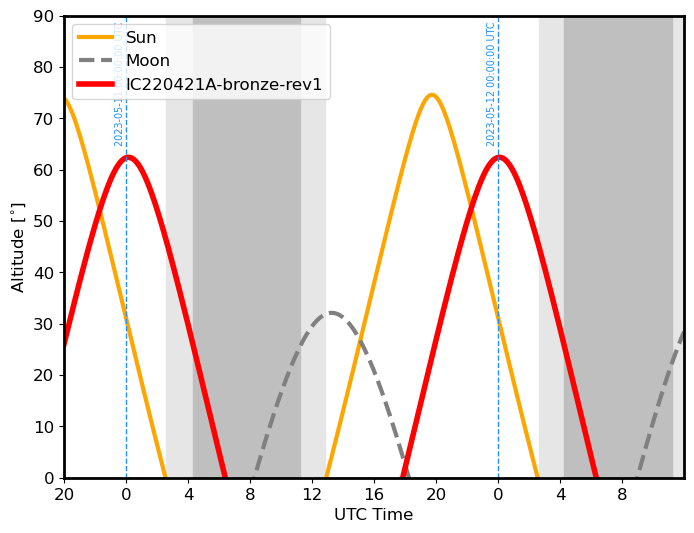
Visibility plots (elevation vs time) for four ground-based instruments over the next hours for the alert. Dark (light) bands indicate civil (astronomical) twilights for each site. Moon and sun elevations are also shown.

Swift visibility
Visibility conditions for Swift at the time of the report generation based on the distance of the alert position to the Sun and Moon. Red or green colors indicate if the position is observable (>23 deg away from the Moon and >47 away from the Sun).
| Sun separation [deg] | 64.8 deg |
| Moon separation [deg] | 152.6 deg |